Table of contents
Citation
Statistics
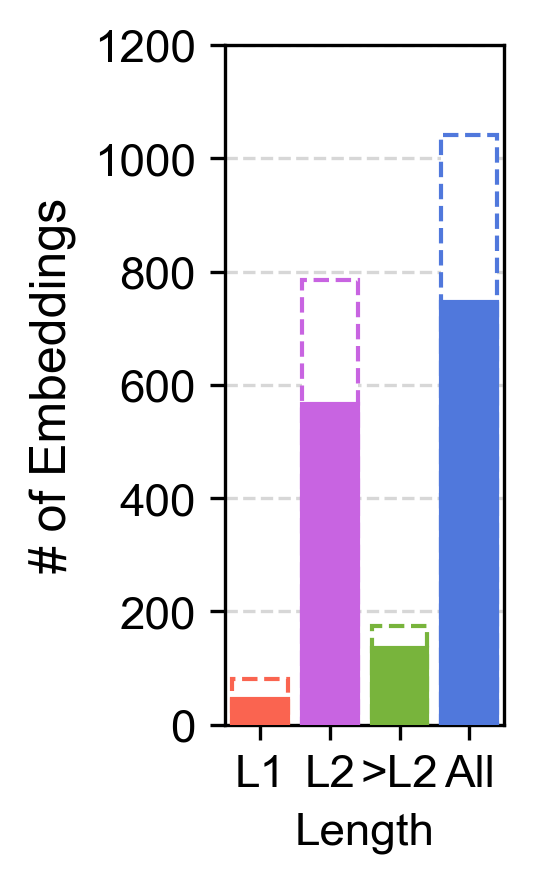
- Left: Number of embedded metapaths per length. Filled bars show the number of unique metapaths.
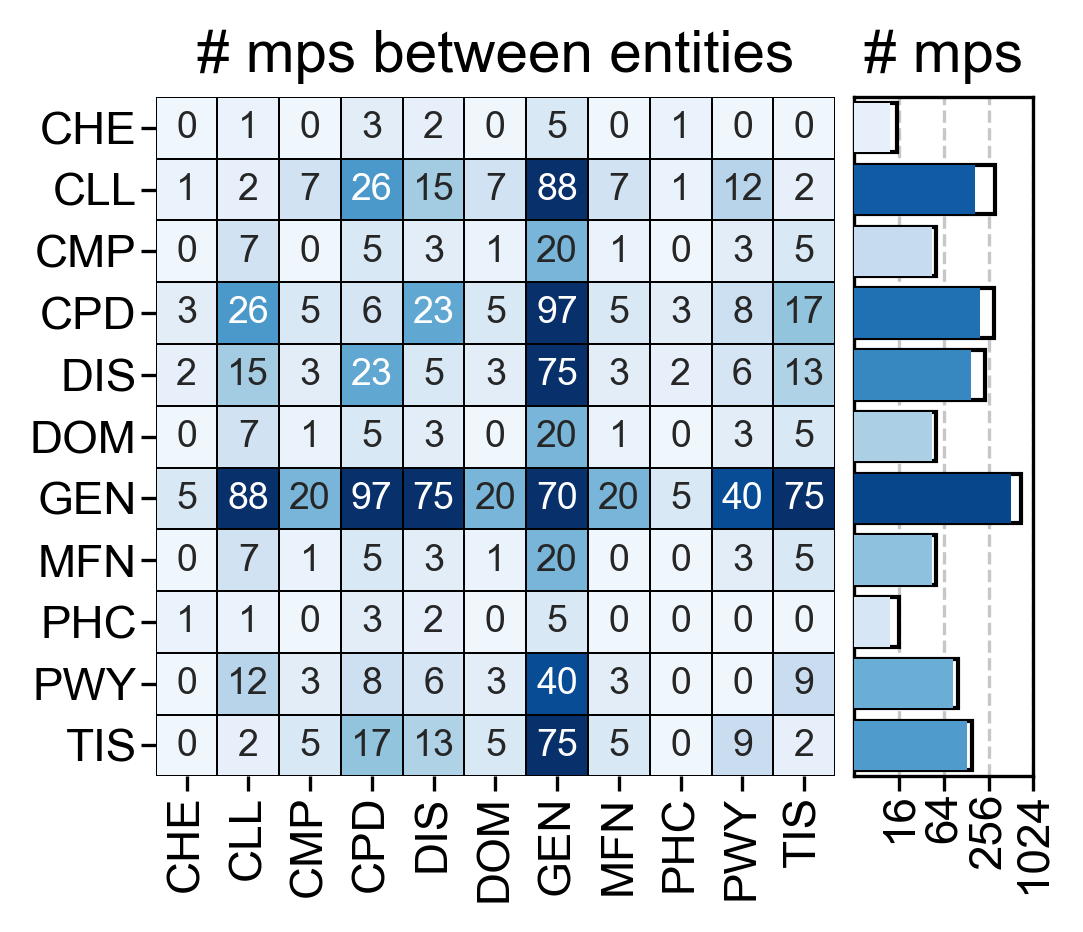
- Central: Number of metapaths between entities. On the right, filled bars show the number of unique metapaths.
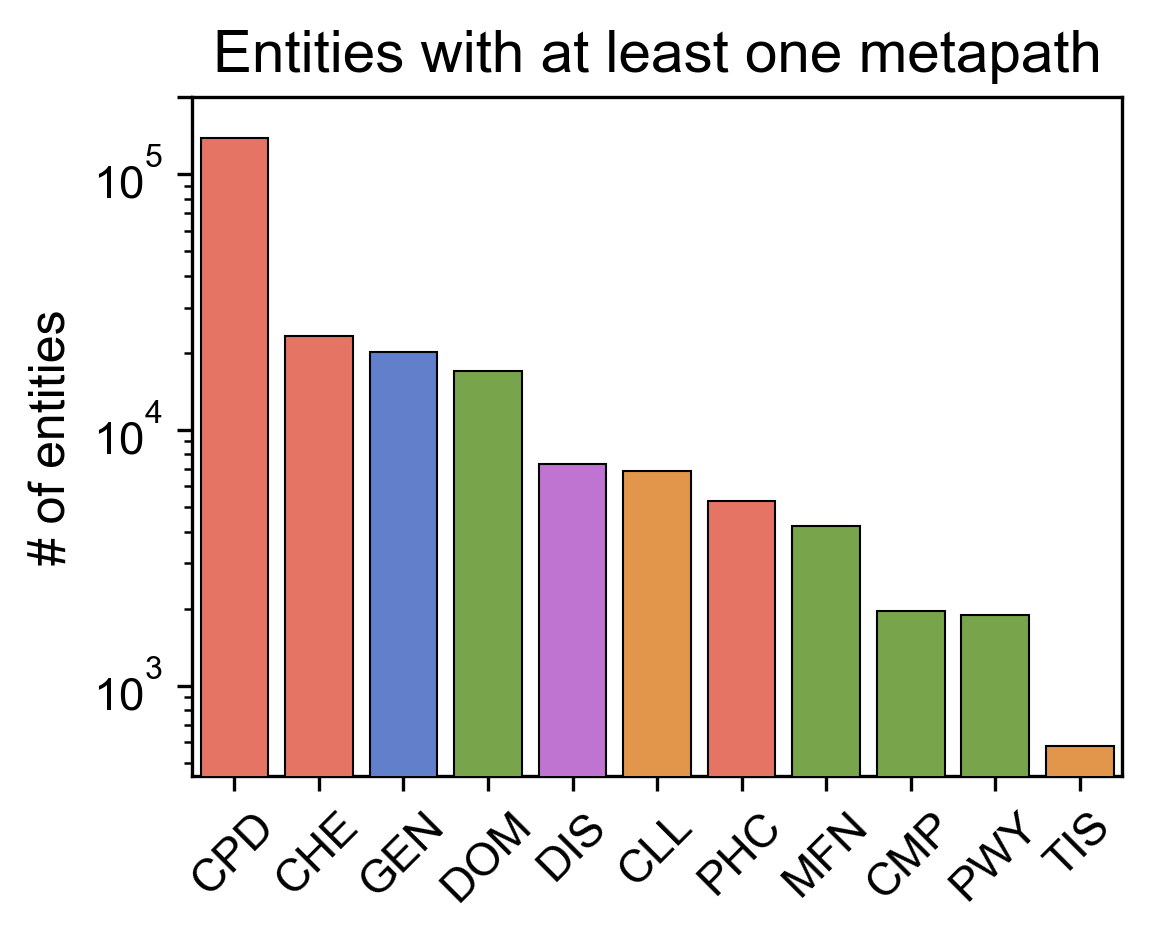
- Right: Number of different entities with at least one embedding.
Bioteque
We present the Bioteque, a resource of biological network embeddings of unprecedented size and scope. To feed the resource, the Bioteque uses a big knowledge graph (KG) holding 12 types of biological entities (e.g. genes, diseases, drugs) and 67 types of relationships.To explore different rationales we listed a set of predefined metapaths which explore the network in a guided way through specific entities, relationships and datasets. The resulting associations provided by the metapath were then encoded in a multi-dimensional space. As a result,
a 128-dimensional vector (embedding) for each entity linked by the metapath is made available in the resource.
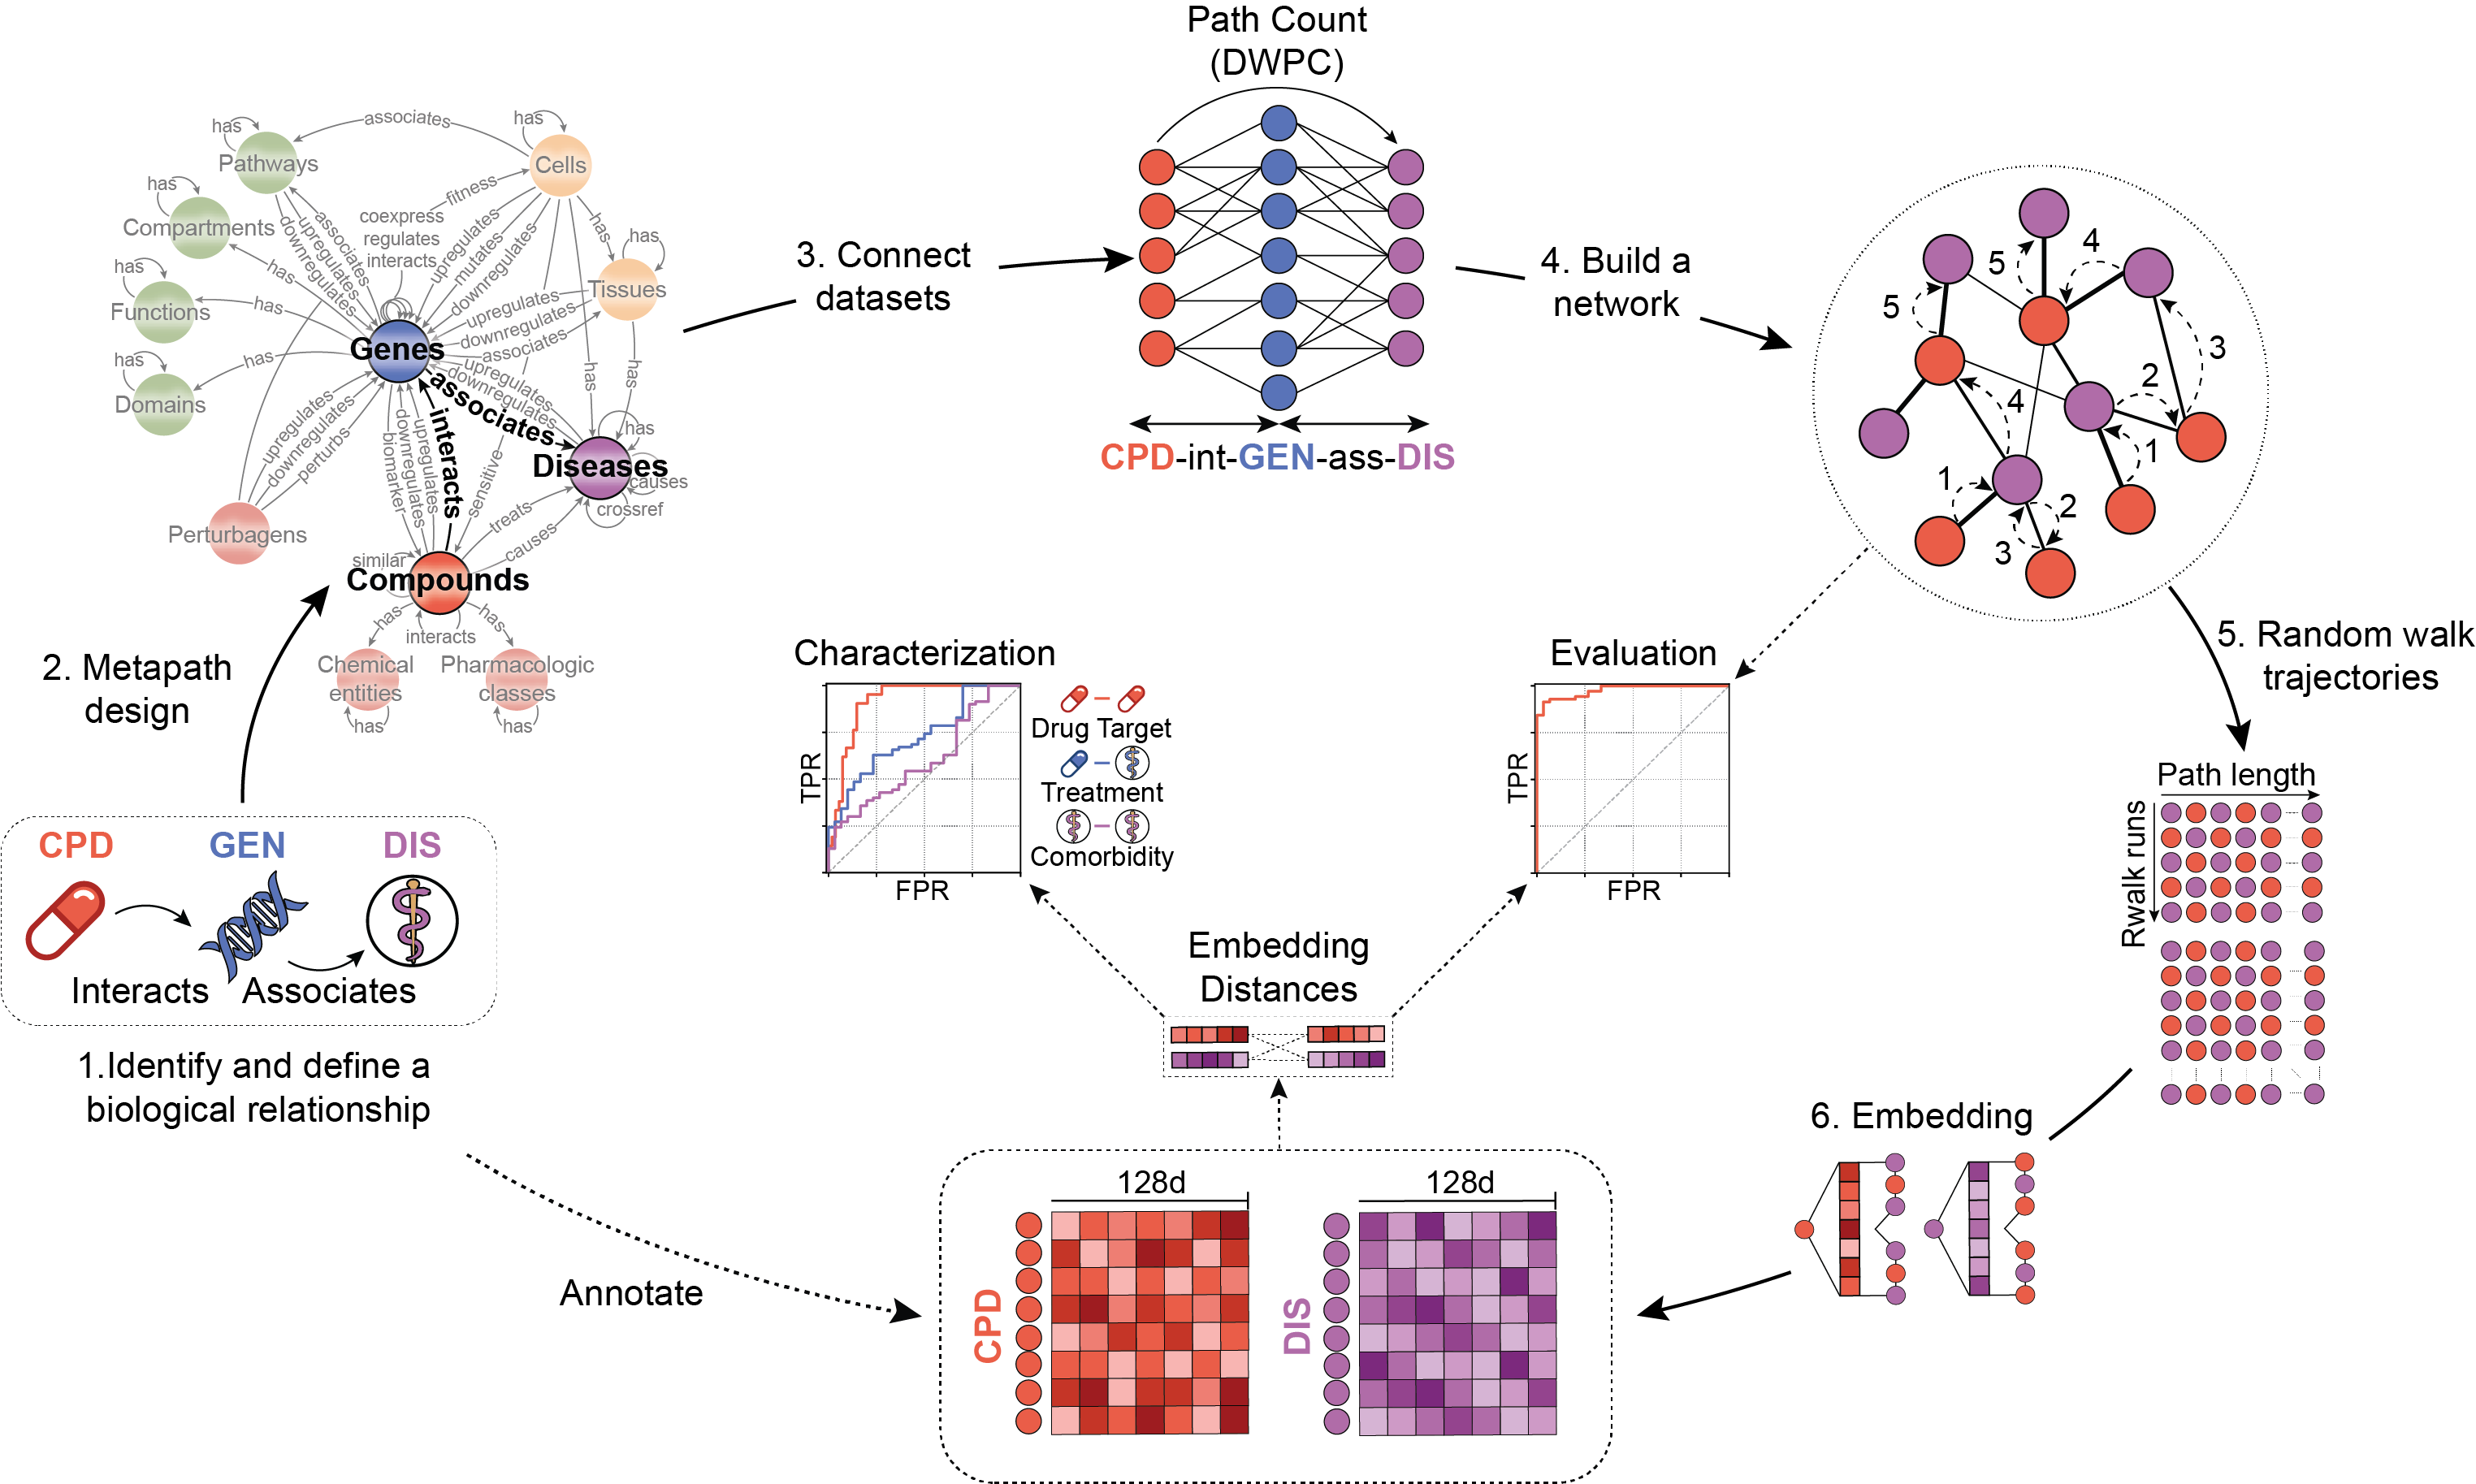
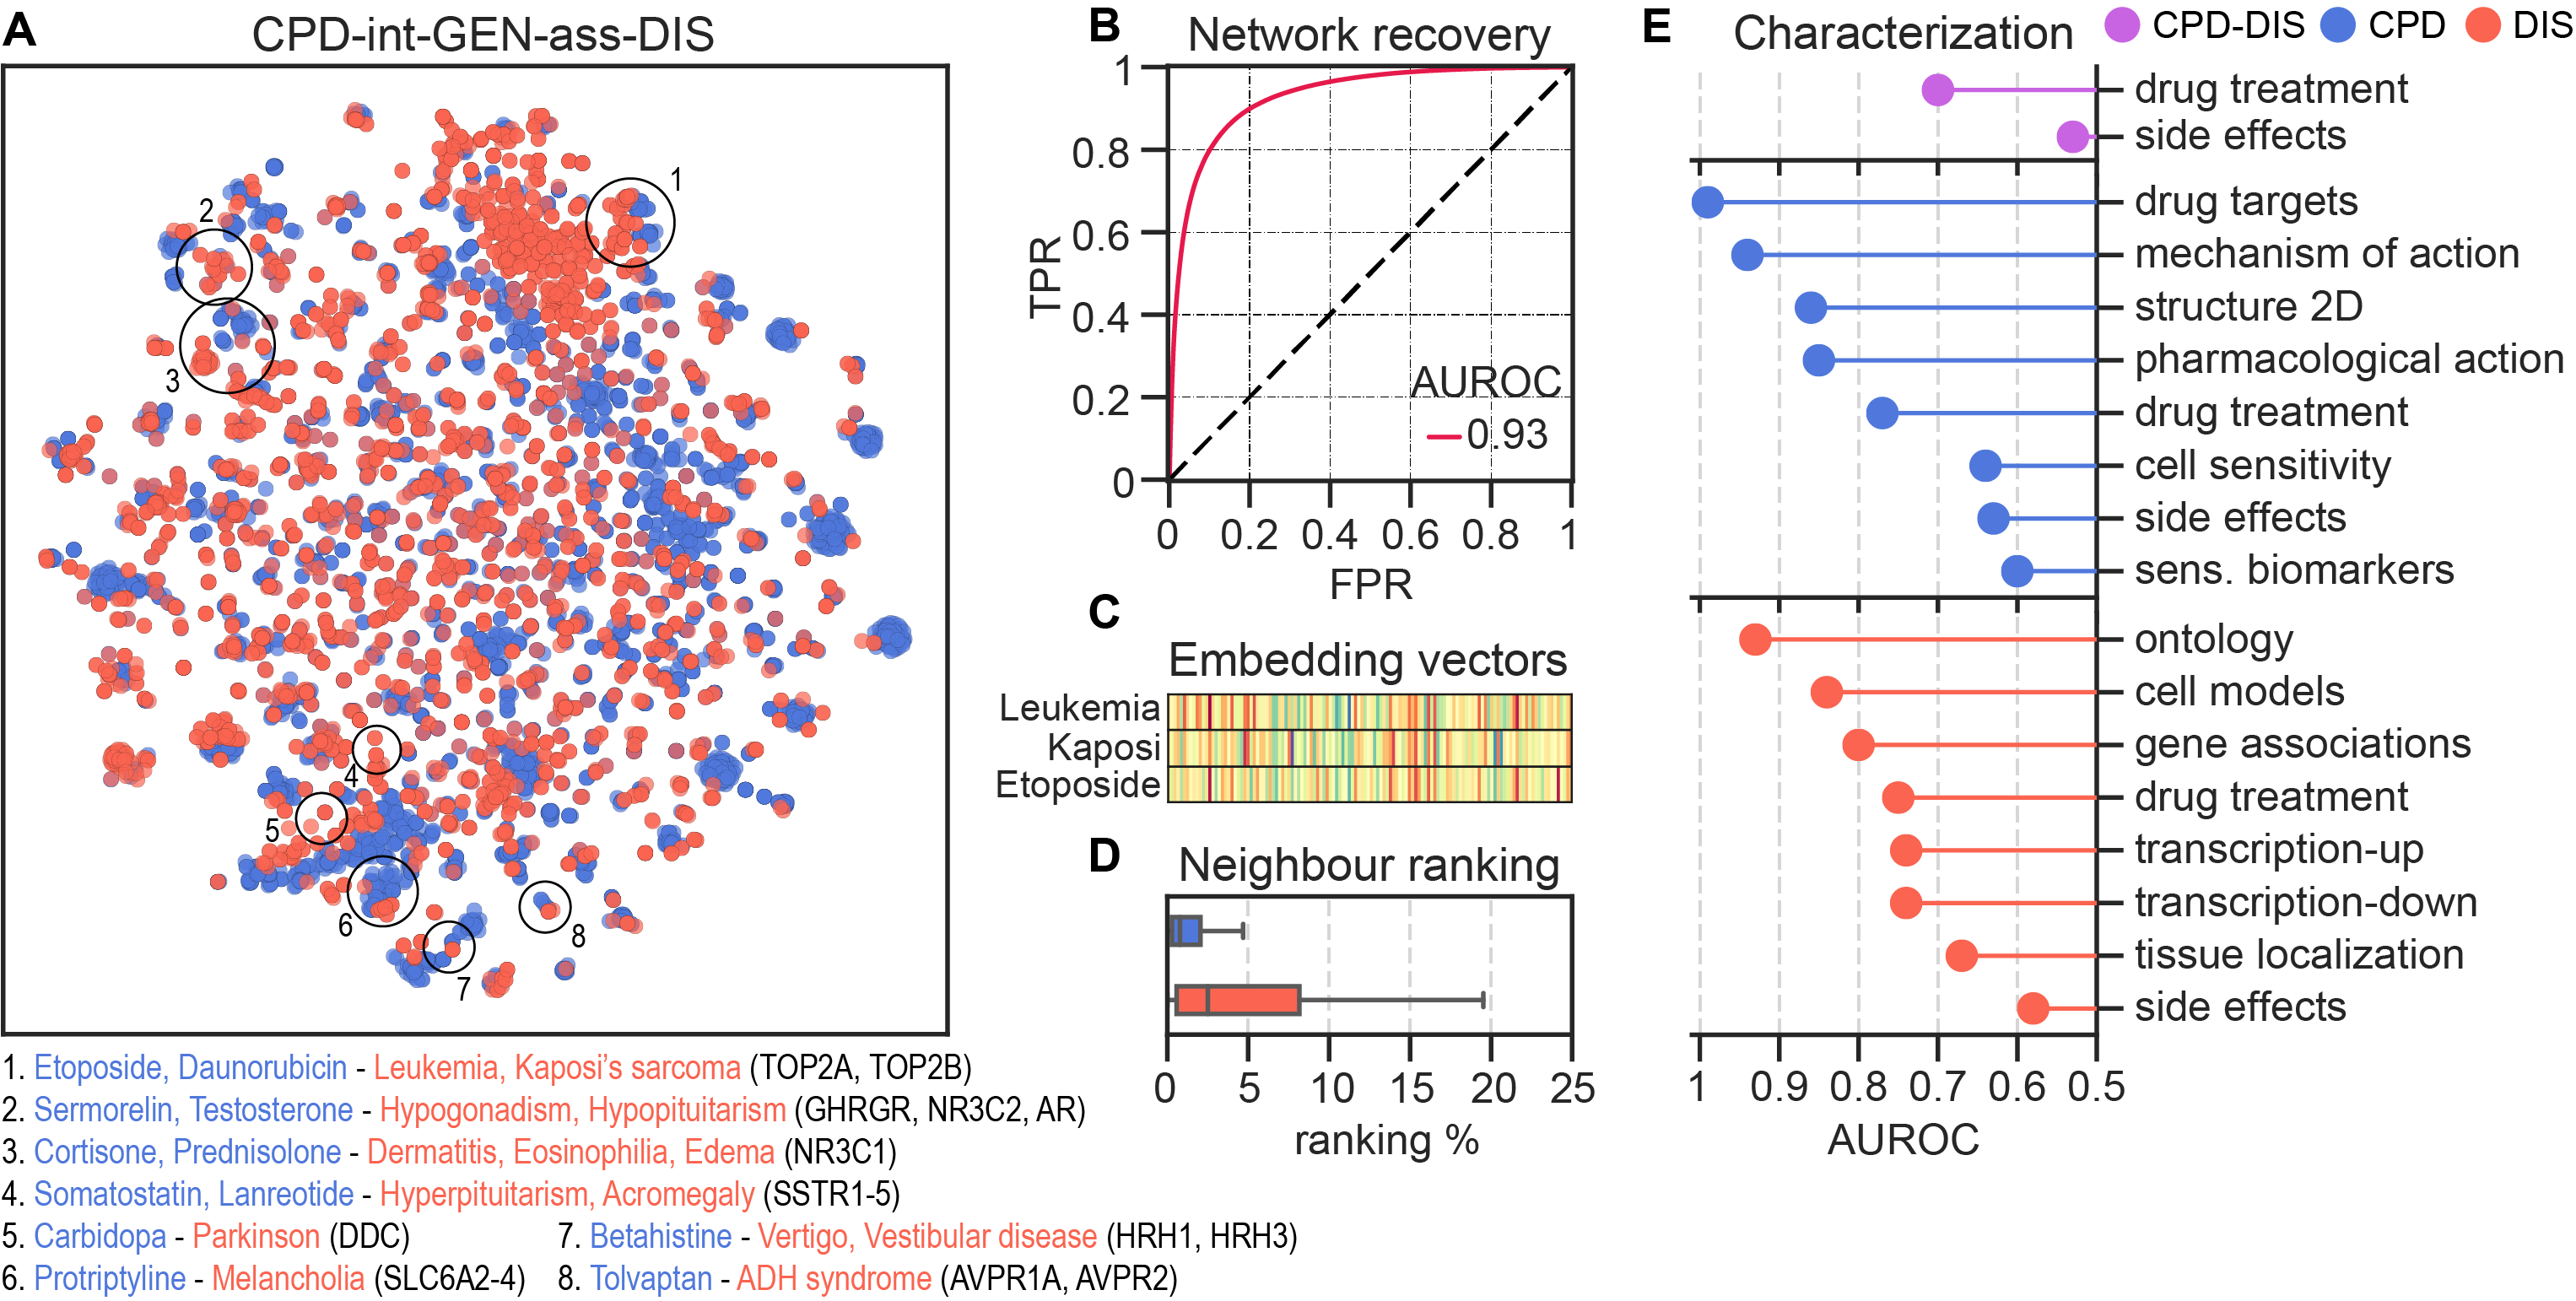
We assessed the quality of the embeddings by reconstructing the metapath associations. Additionally, we characterized the embedding space by quantifying the recapitulation of biological well-known associations (e.g. curated gene-disease associations, drug targets or protein interactions, among others).
BQsupports
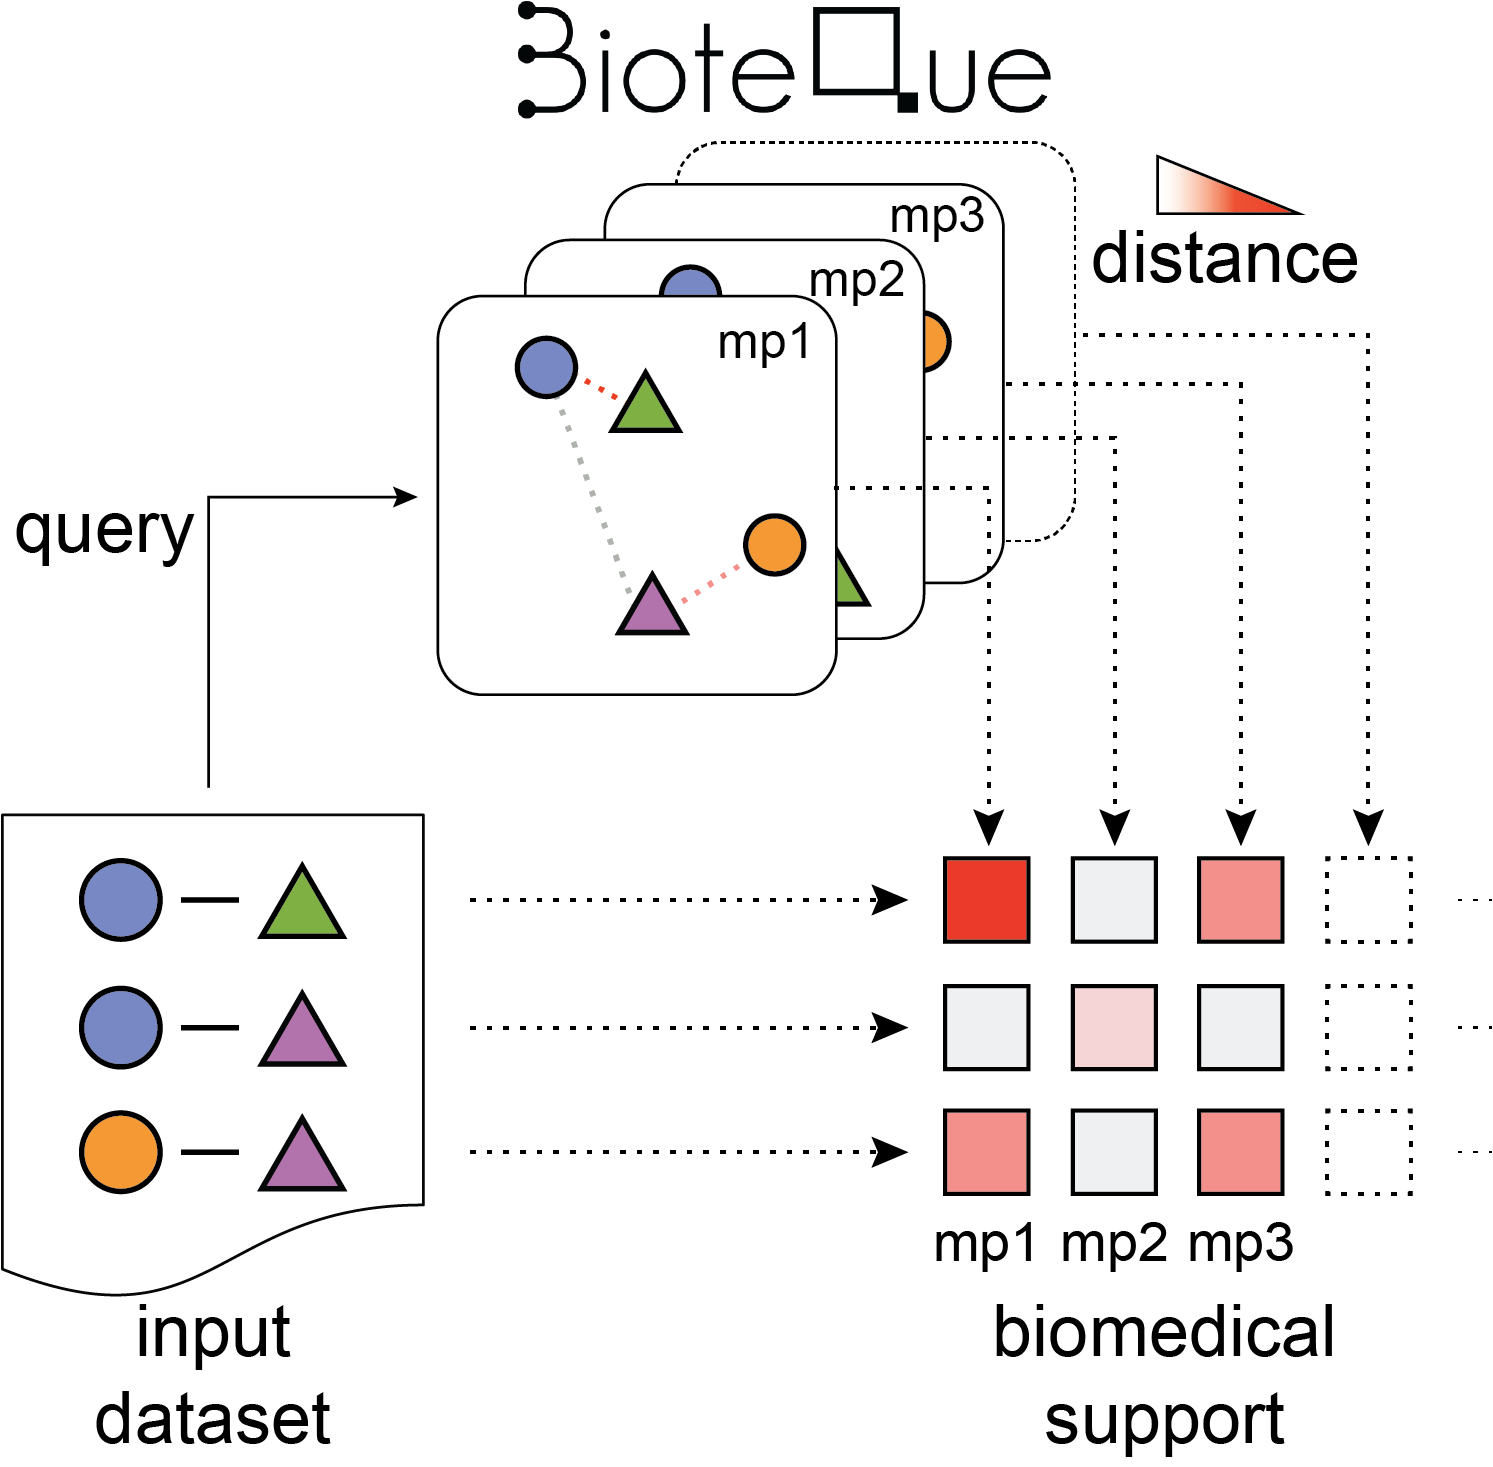
BQsupports is a tool intended to help scientists to better understand the biomedical relationships existing between their experimental observations. To this end, BQsupports uses the rich variety of biomedical descriptors (embeddings) in the Bioteque to annotate 'support scores' to each association (pair of entities) provided by the user.BQsupports provides:
- Support scores for each individual observation across different biomedical descriptors, providing insights for hypothesis generation.
- The fraction of edges supported in the given datases, hence, making a first assessment of the 'novelty' of the dataset.
- Biomedical descriptors with potential to predict new dataset-specific associations in downstream tasks.
How does it work
1. Selecting the biomedical descriptors universe
Given a set of node pairs covered by the Bioteque resource, BQsupports automatically identifies biomedical descriptors (i.e., Bioteque metapath embeddings) potentially related to the input data. It considers metapaths of any length available in the Bioteque resource with the exception of GEN-GEN associations, which are limited to L1 metapaths. Metapath covering less than 10% of the data are omitted.
2. Calculating the support scores
The cosine distance of each node pair is measured in each embedding space and ranked according to the metapath distance distribution. To efficiently obtain these rankings, only the top 25% closest neighbours (first quartile) for each node is considered. Accordingly, the maximum ranking distance is set to the one defined by the first quartile. Next, rankings are divided by the total number of nodes in the embedding space, thereby transforming rankings into quantiles. Finally, as this process generates two quantiles (i.e., we obtain one ranking for each node), we derive an edge-level quantile by keeping the geometric mean of the pair (i.e., the normalized co-rank). This process is repeated independently for each metapath-dataset descriptor available in the pre-selected universe.
3. Assessing the expected support
The tool uses network permutations to (i) derive the expected support of the dataset and (ii) detect entity pairs that are significantly close (supported) in a particular biomedical context (quantified by an enrichment score). The user can specify the number of permutations (between 10-1000, default: 20). Each network permutation is obtained by randomly swapping the association of the dataset n times (where n is set to be 10 times the number of edges). Then, quantile ranking scores are calculated independently for each network permutation following the pipeline described in the previous section.
Enrichment scores are computed for each metapath and different support scores (only computed if the given network has 50 or more edges). More specifically, given a metapath-source descriptor space and a quantile cutoff (tested range between 1 and 0.001), the pipeline first annotates the number of associations in the given dataset scoring lower than the given quantile cutoff. Then, this number is divided by the median number of associations obtained from the random permutations, obtaining a Fold Change (FC). An empirical P value is derived by counting the proportion of permuted networks with equal or more associations than the original dataset.
4. Identifying potential predictors
To suggest potential predictors, the tool evaluates the capacity of the metapath descriptor to distinguish the dataset associations from random permutations (only computed if the given network has 50 or more edges). To assess that, the cosine similarities of the associations are treated as probabilities to uprank ‘real’ edges (i.e., given by the user) from random permutations. An Area Under the Receiver Operating Characteristic (AUROC) curve is computed between the user edges and 10 random permutations, and the average is provided as the final recapitulation score.
Additionally, the pipeline also seeks metapath descriptors that, while not directly preserving the associations provided by the user, it does retain the neighbourhood similarity of the nodes. For each entity type, the pipeline builds a new similarity network by linking the nodes with other nodes of the same type according to the similarity of their neighbourhood (i.e., nodes are linked if they are significantly associated with the same nodes). This similarity network is obtained by keeping, for each node, the top 3 most entities with highest TF-IDF similarity (i.e., we represented each node with a binary vector annotating their interactions). Then, if the similarity network has 50 or more edges, a new metapath universe is listed for this new network and the recapitulation (AUROCs) of these metapaths are computed following the same approach described in the previous paragraph.
Input format
| Entity | Expected format | Example |
|---|---|---|
| Chemical entities (CHE) |
Chemical Entities of Biological Interest (ChEBI) ontology terms. | CHEBI:100, CHEBI:995, CHEBI:100148 |
| Cell lines (CLL) |
Cellosaurus ids. | CVCL_0002, CVCL_0434, CVCL_ZV51 |
| Celullar compartments (CMP) |
Biomolecular structures as defined by the Gene Ontology. | GO:0000109, GO:1990923, GO:0005654 |
| Compounds (CPD) |
Small molecules codified with the standard InChIKey. | AAAAZQPHATYWOK-JXMROGBWSA-N, ZZZRUAITSXLWBH-PGBZFOFMSA-N |
| Diseases (DIS) |
Disease ontology (DO) id terms. | DOID:0001816, DOID:9993, DOID:450 |
| Domains (DOM) |
InterPro human protein domain ids. | IPR000001, IPR007084, IPR043628 |
| Genes (GEN) |
Human reviewed Uniprot entries. | IP00533, Q96EB6, A0A024RBG1 |
| Molecular functions (MFN) |
Molecular functions as defined by the Gene Ontology. | GO:0000016, GO:0043199, GO:1990948 |
| Pharmacological classes (ATC) |
Anatomical Therapeutic Chemical (ATC) codes. | A, B02, C02B, V10XX03 |
| Pathways (PWY) |
Human (Reactome) Pathways. | R-HSA-109581, R-HSA-2485179, R-HSA-8957322 |
| Tissues (TIS) |
Tissues and cell types from the BRENDA Tissue Ontology (BTO). | BTO:0000020, BTO:0000393, BTO:0006078 |
*Note: the exact entity universe covered by BQsupports can be explored here.
Output interpretation
The pipeline outputs the following files:- supports.tsv: This file provides the quantile ranking (support), cosine distance, z-scored cosine distance, and enrichment scores for each edge in each metapath-dataset.
- metapath_counts.tsv: Number of edges supported by each metapath-dataset at different support score cutoffs.
- edge_recapitulation.tsv: Recapitulation score (AUROCs) for each metapath assessed as potential predictor of the given network.
- XXX_neighbours_recapitulation.tsv: Recapitulation score (AUROCs) for each metapath assessed as potential predictor of similar interactors in the network.
- canvas.png: Figure summarizing all the results. A legend of the figure can be found below.
- edges.tsv.gz: List of edges used by the BQsupports (after removing duplications).
- README.txt: Legend for the outputted files and figures
- WARNINGS.txt (optional): Warnings that happened during the processing of the network (e.g., steps that were skipped due to lack of data, if any).
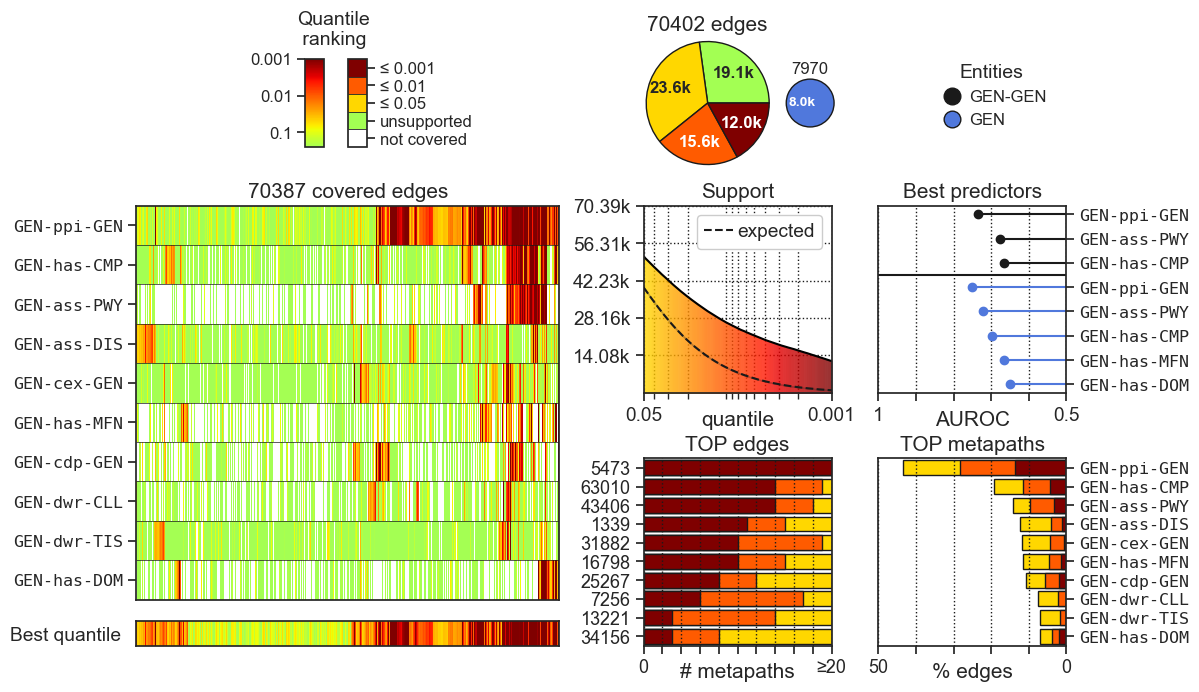
- The heatmap on the left, shows the quantile ranking (support score) for all the input relationships (y-axis) given by the top 10 most supportive metapaths (x-axis). The lower (redder) the quantile rank the higher the support score.
- The pie chart on the top quantifies the number of associations supported by at least one metapath at a given support cutoff. The small pie chart on the right indicates the number of entities covered by at least one metapath.
- The Support plot below the pie chart quantifies the support of the input dataset across different quantiles. The ‘expected support’ line indicates the support achieved by permuted networks, where network edges have been randomly shuffled N times.
- The Best predictors plot on the right ranks metapaths according to their potential to be used as features for predicting new dataset-specific interactions.
The analysis is run trying to (unsupervisely) predict (i) the provided network pairs (black) and (ii) pairs of nodes having a similar interaction profile (colored by entity).
- The TOP edges plot on the bottom shows the most supported input edges. The labels in the y-axis shows the index position (starting from 1) of the edge in the network provided in the edges.tsv.gz file.
- The TOP metapaths plot on the bottom-right corner shows the metapaths that most support the dataset.
Computational time
With the default number of permutations, the entire pipeline takes 1h-2h to run, depending on the entity types and number of edges (left plot).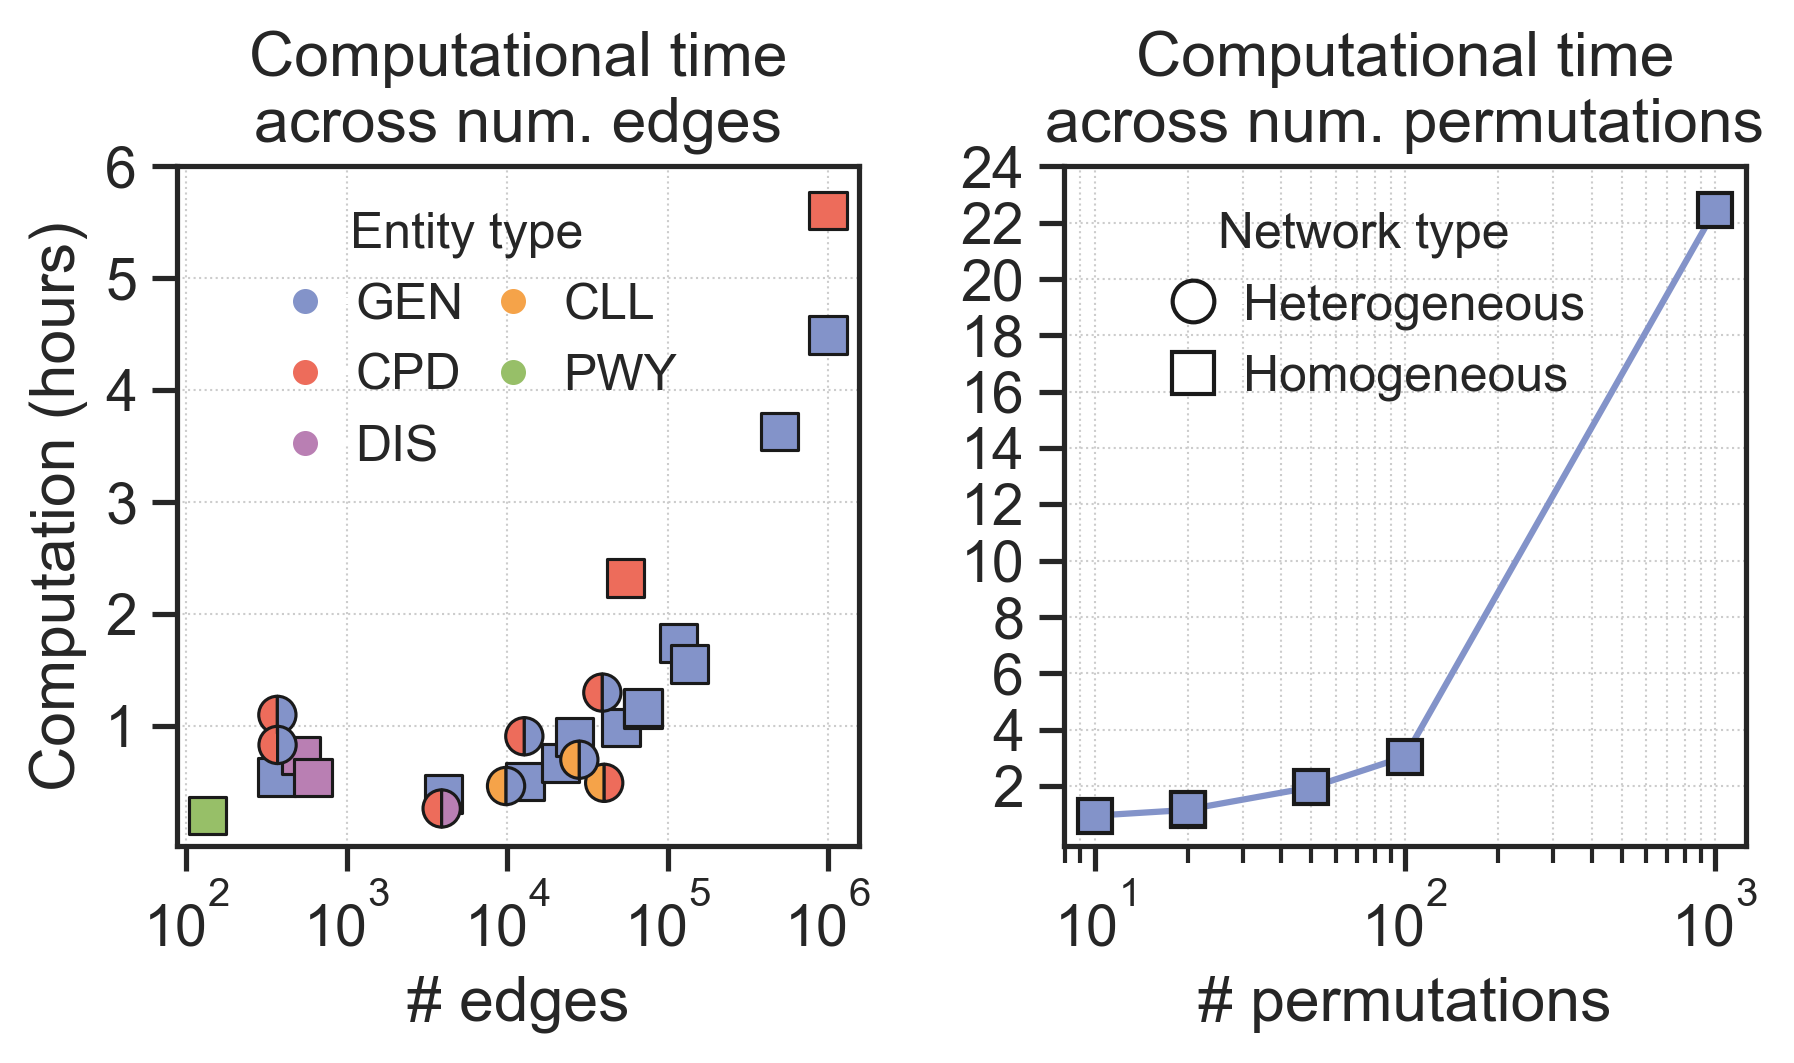
The number of permuted networks significantly impacts the computational time. For example, in the Bioplex-III network, moving from 20 to 100 random permutations added two hours of extra computation, while moving from 100 to 1000 added 18h more (right plot).